Hult MSc Business Analytics coursework · Business intelligence · 2026
Marriott labour analytics and audit
A Power BI suite that joins timekeeping with scheduling to track labour spend, overtime, attendance and compliance for about 225 hourly employees at a Marriott-managed property. A follow-up audit re-implements every measure in Python and corrects the ones that were wrong.
The problem
Hotel managers need to see labour spend and compliance risk week by week: who is heading into overtime, who is breaching the 19-hour cap for student workers, and where attendance is slipping. The raw material is two operational exports that don't share a clean key: Kronos timekeeping punches and WhenToWork planned shifts.
The dashboard
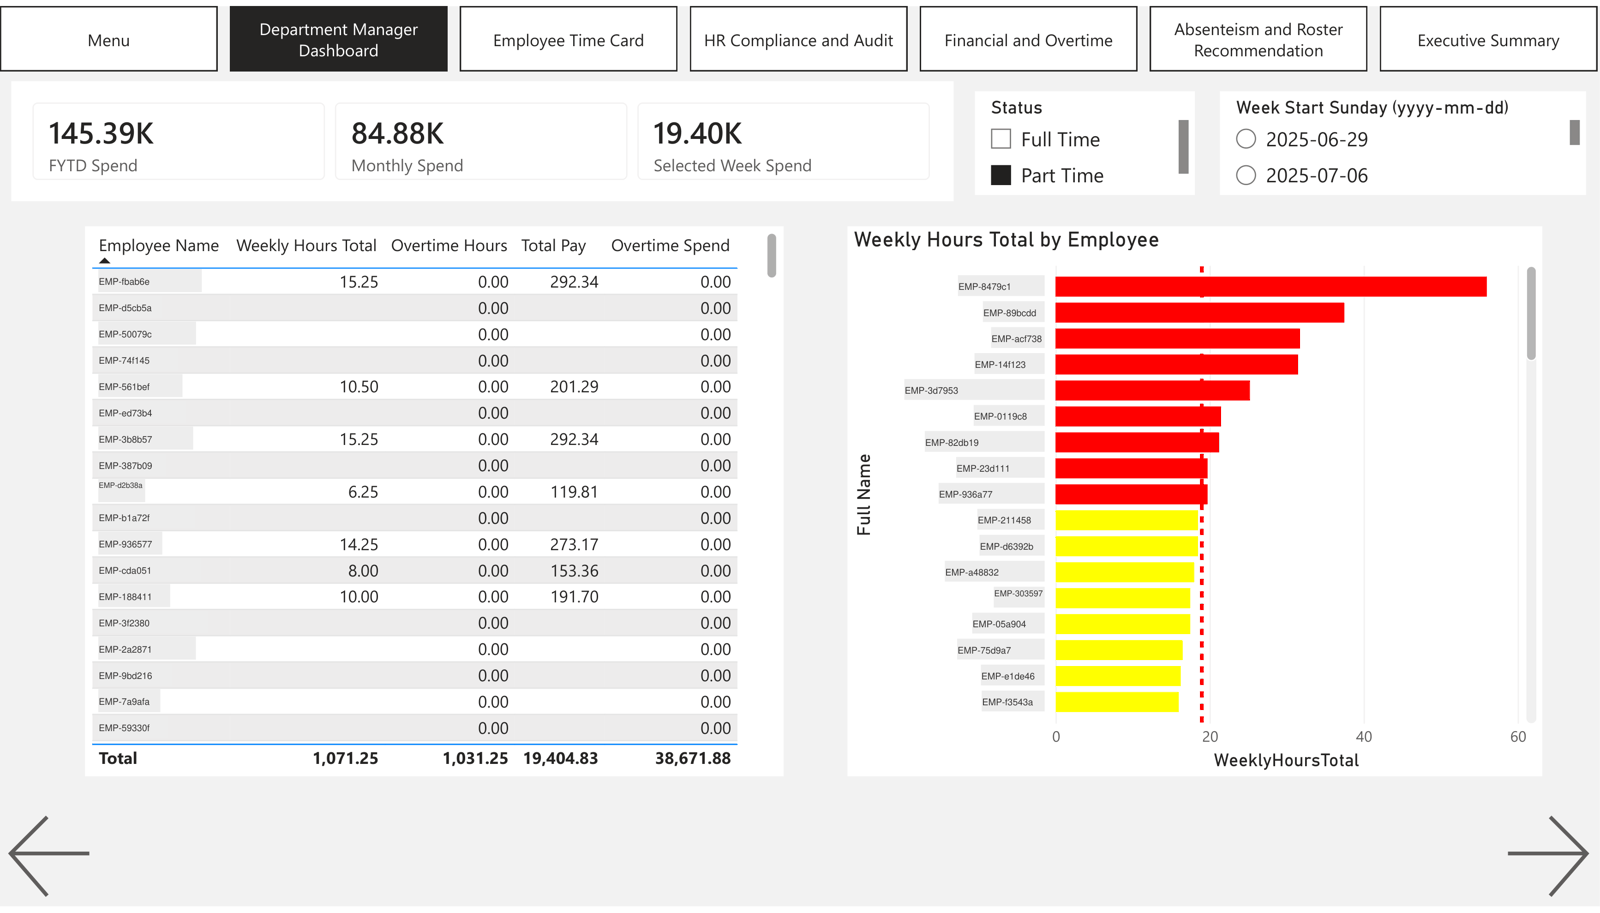
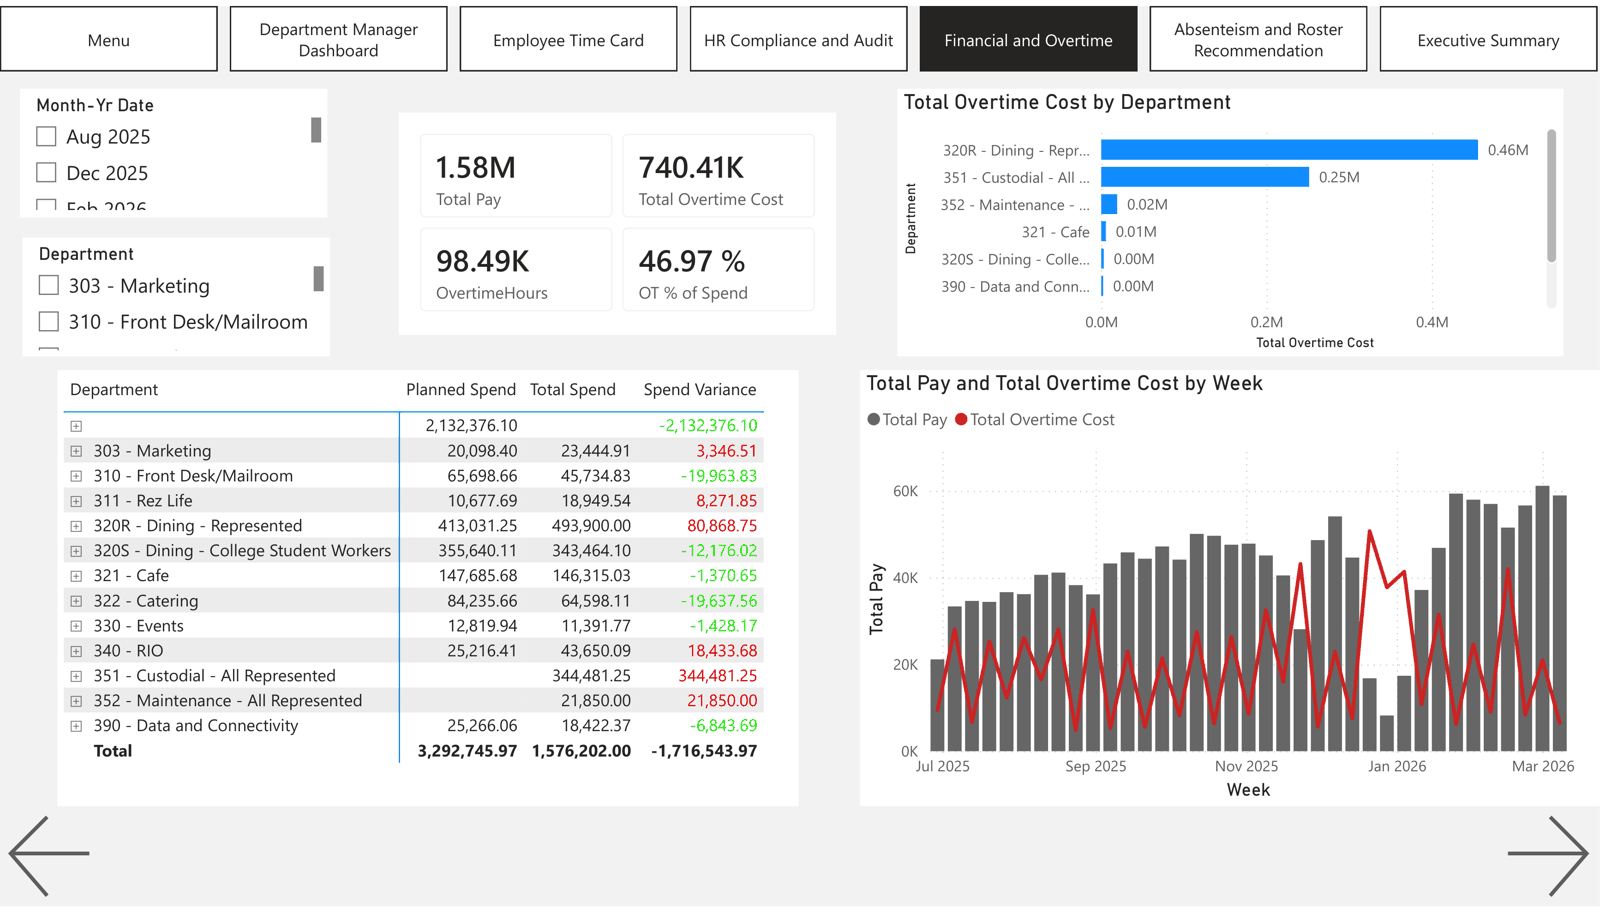
Seven pages, one per audience: department managers, supervisors, HR, finance, operations and leadership.
The audit
Re-running the model's logic on its own data showed the headline story was mostly an artefact.
| v1 dashboard | v2 corrected | |
|---|---|---|
| Overtime share of pay | 47.4% | 4.4% |
| Overtime hours | 19,852 | 1,920 |
| Absenteeism | −119% to 20% (unstable) | 7.1% |
| Impersonation cases | 212 | not measurable |
| Rounding "gaming" | ≈ 5,000 shifts | at chance level |
Why:
- Paid leave was counted as hours worked, so holidays pushed people over the 40-hour overtime line. About 90% of v1's overtime was leave.
- The impersonation measure counted every employee, and the punch-location fields in the export are empty, so impersonation can't be tested at all.
- The overall rounding rate matched what random punch minutes produce (25.1% against 24.9%), though 30 employees sit far above it.
- The name join lost 44% of planned shifts. A tiered matcher now links 69%.
What survives: Dining is still the largest overtime department, and part-timers routinely breach the 19-hour cap (73 of 196 in at least one week).
Privacy
This is a real HR export. Names and employee IDs are replaced with codes (an HMAC-SHA256 of the ID under a key that never leaves the owner's machine). The Power BI file and raw exports are not published, and the employer is named only as "a Marriott-managed property".
Limitations
- One property and one export period.
- A third of planned shifts still can't be matched to a timekeeping record, so no-show rates are estimates.