Professional work · Summr Capital Management · 2026
Regime-conditional leveraged-ETF strategy
Leveraged ETFs compound gains in calm trends and bleed value in choppy markets. This rules-based, weekly strategy holds leveraged exposure only when its regime read favours it, and rotates to commodities or short-term Treasuries otherwise.
The idea
A 3× fund that resets daily loses about 3% a year to volatility drag when the index is flat at 10% volatility, and about 45% at 45% volatility. The usual answers are binary: hold these funds and absorb the drag, or avoid them. Both treat a regime-dependent property as a constant. If the regime can be read before the week starts, leverage can be held selectively.
How it's built
A six-stage, fully rules-based pipeline runs once a week, with no discretionary override at any stage:
- Regime model. A three-state Gaussian hidden Markov model reads the market state.
- Regime classifier. A composite of market signals confirms or overrides it.
- Signal scoring. Each instrument is scored within the regime.
- Risk budgeting. Each instrument group gets its own risk budget.
- Portfolio construction. Weights come from the scores and budgets.
- Risk governor. Drawdown and exposure limits have the final say.
Thresholds, signals, instrument selection and sizing rules are proprietary and deliberately left out.
Results
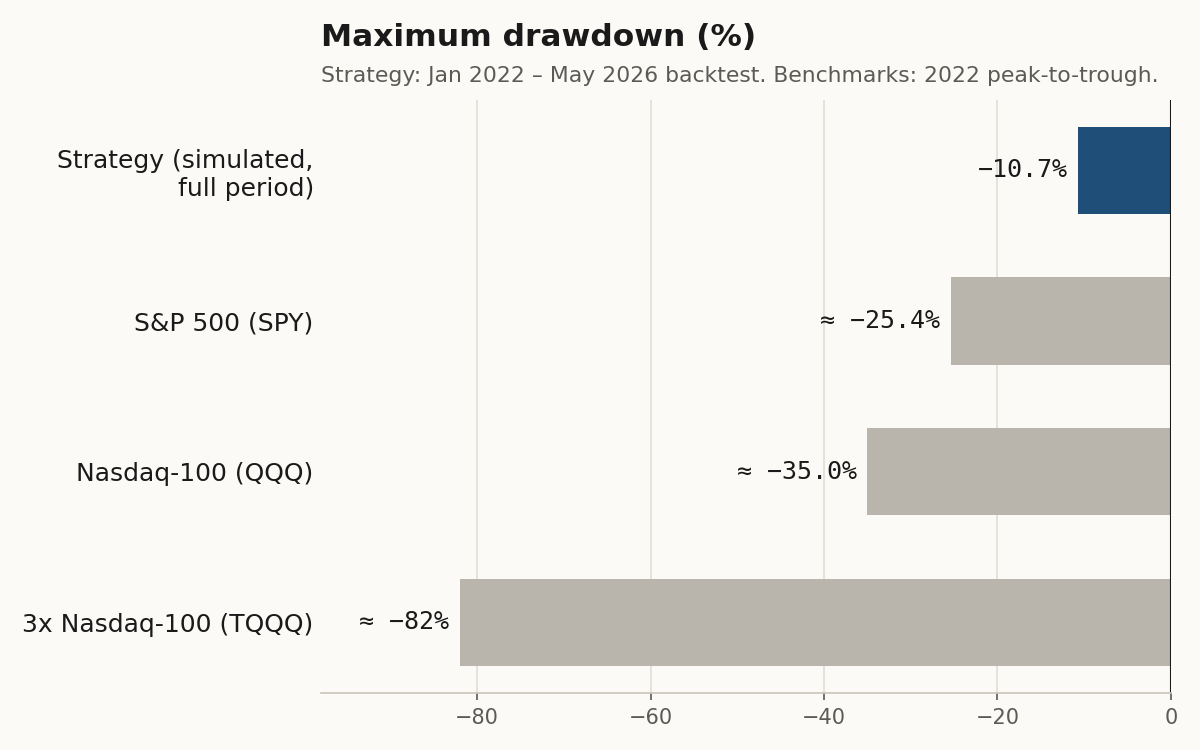
This is not a higher-return strategy. Its 14.6% compound return is in line with holding the Nasdaq-100, at about one-third of its drawdown, and ahead of a 3× Nasdaq-100 fund's roughly 10.9% at about one-eighth of its drawdown.
Validation
- Walk-forward: an out-of-sample Sharpe of 0.98 against 1.01 in-sample, so almost all of the edge held on unseen data.
- Selection bias: 35 configurations were tested, so the Sharpe ratio was deflated (Bailey and López de Prado, 2014). The Deflated Sharpe Ratio ranges from 0.97 to 0.45 depending on how widely the 35 results varied, a figure still to be measured.
- Serial correlation: a Ljung–Box p-value of 0.595 shows no autocorrelation inflating the Sharpe ratio.
Limitations
- The out-of-sample window fell in a favourable regime.
- Benchmarks are compared on end-of-period aggregates, not week by week.
- Transaction costs, slippage and capacity still need confirmation before live trading.